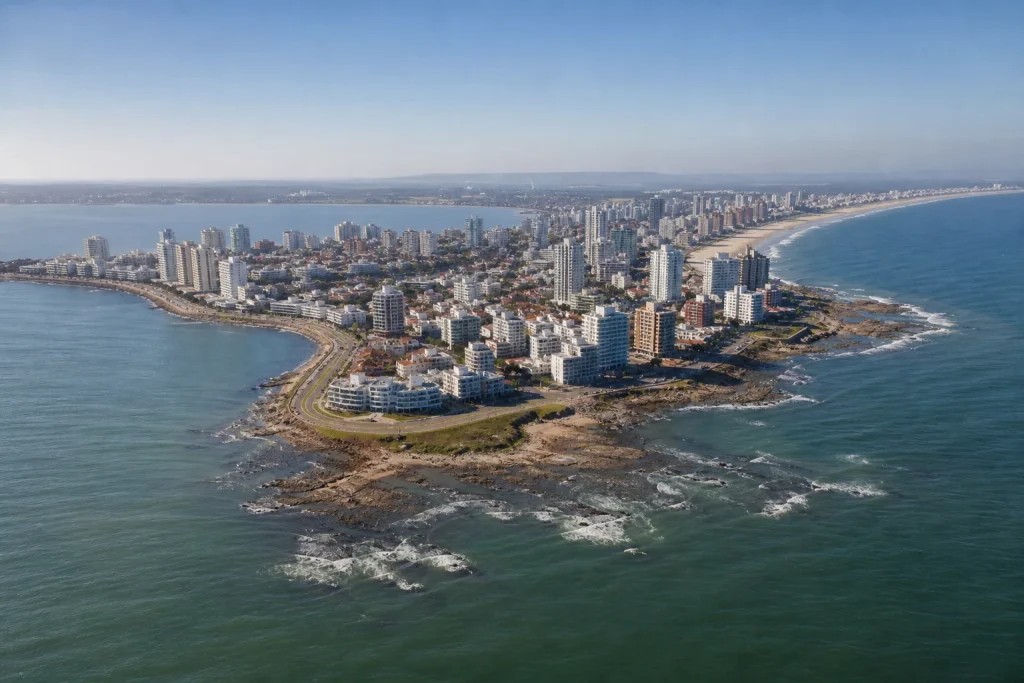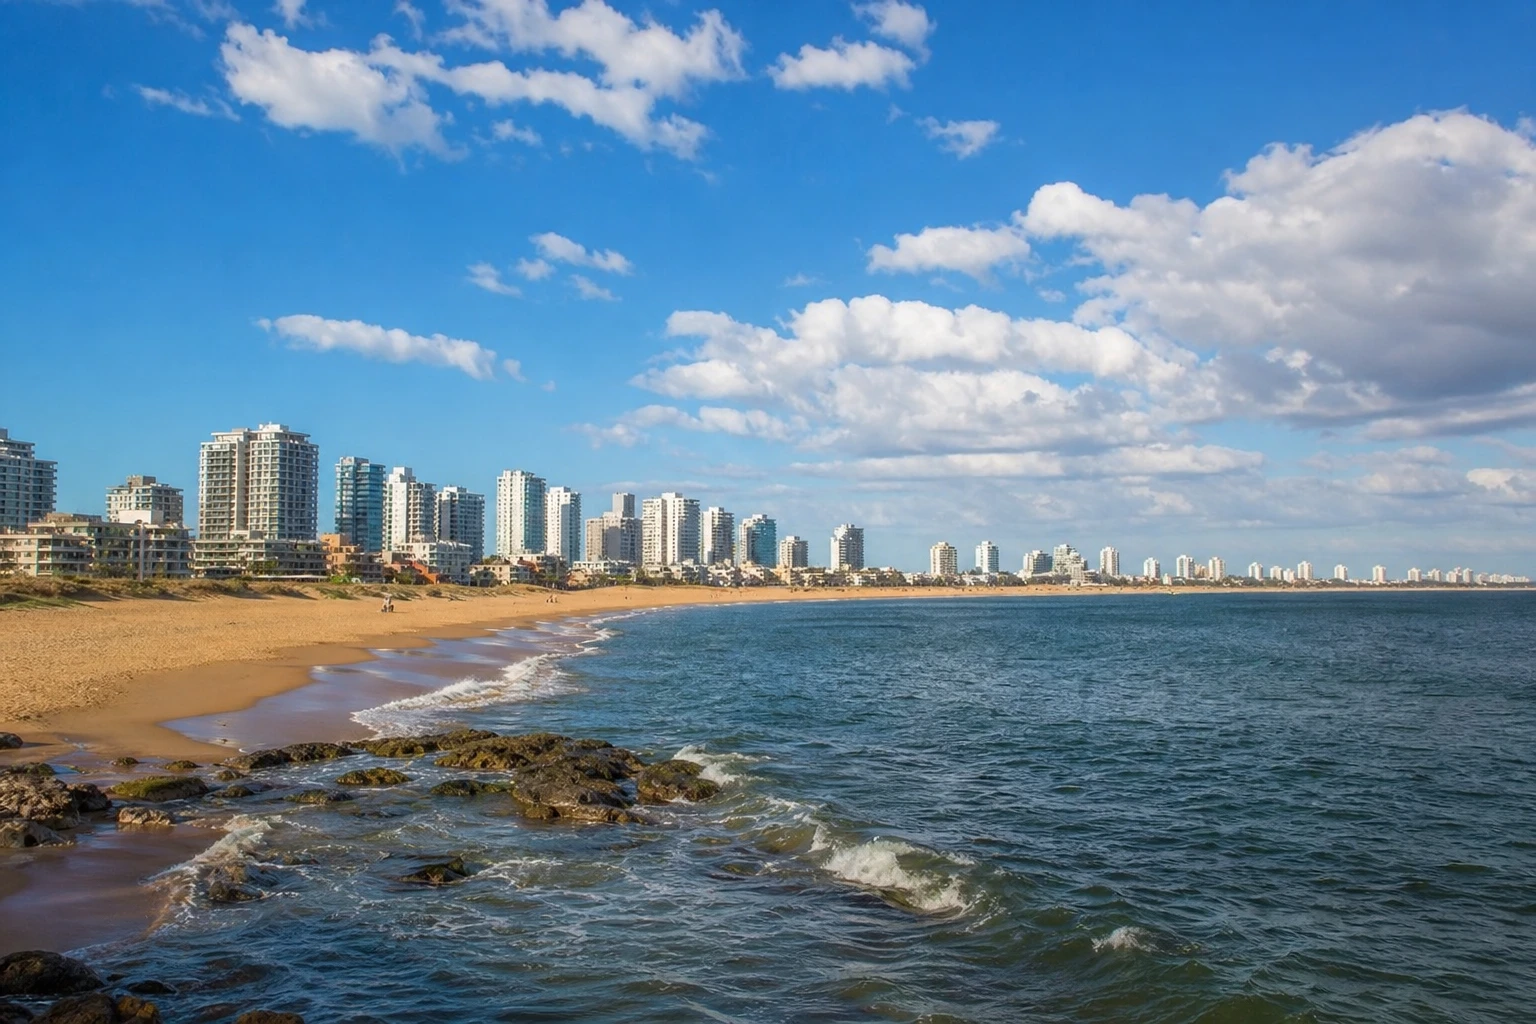
Punta del Este has warm summers, cool winters, and meaningful rainfall in every month. December through February offers the warmest conditions for a beach-centered trip, while June through August calls for layers and more flexible outdoor plans. The figures below use an official regional climate benchmark and should be paired with a current Punta del Este forecast before departure.
- December through February is the warmest period in the regional benchmark.
- January has the highest monthly mean temperature at 23.2°C, or 73.8°F.
- June through August is coolest, with July averaging 9.9°C, or 49.8°F.
- No month is reliably dry; monthly precipitation averages range from 66.2 to 147.8 mm.
- Check Punta del Este forecasts and alerts close to departure, especially for wind, rain, fog, and thunderstorms.
The detailed monthly figures come from the Uruguayan Institute of Meteorology climate table for Carrasco Airport near Montevideo. They are useful as a regional planning benchmark, but they are not observations from a Punta del Este weather station. Treat them as a guide to broad seasonal patterns rather than a promise about any particular week.

Punta del Este Classic City Tour with Sunset at Casapueblo
This tour is the best way to get to know Punta del Este in depth. If it's your first time in Punta, we recommend taking the City Classic to get a good...

Punta del Este Shore Tour for Cruise Passengers
Join us on a tour to discover Punta del Este, one of Latin America’s most exclusive destinations. With its elegant...

Punta del Este Shore Excursion: Private Sightseeing Tour of Punta del Este
Explore the sophisticated resort town of Punta del Este on this 4-hour private shore excursion. With a private guide...

The Best of Punta del Este Old Town Private Walking Tour
Discover the best of Punta del Este’s historic center, from the iconic Fingers sculpture to the historic lighthous...
How to use this monthly weather guide
Mean temperature describes the month as a whole. The mean high and mean low are also monthly climate averages, not the expected maximum and minimum on every day. A trip can include conditions above or below those values, particularly when a front, strong wind, or thunderstorm passes through the region.
Rainfall totals require similar care. A monthly precipitation average does not reveal how many hours it rains, whether rain falls overnight, or how showers are distributed across a week. It is most useful for one conclusion: rain belongs in the Punta del Este packing plan throughout the year.
Weather is also only one part of choosing a date. For a broader look at seasonal atmosphere and trip timing, the Summer Season vs Quiet Off-Season comparison can help place these climate figures in context.
Monthly temperature and rainfall benchmark
| Month | Mean temperature | Mean high / low | Average precipitation |
|---|---|---|---|
| January | 23.2°C / 73.8°F | 28.3°C / 18.2°C | 105.4 mm |
| February | 22.4°C / 72.3°F | 26.9°C / 18.4°C | 147.8 mm |
| March | 20.0°C / 68.0°F | 24.9°C / 15.5°C | 74.9 mm |
| April | 17.1°C / 62.8°F | 21.7°C / 12.7°C | 91.2 mm |
| May | 14.4°C / 57.9°F | 18.8°C / 10.2°C | 66.2 mm |
| June | 11.1°C / 52.0°F | 15.7°C / 6.7°C | 72.5 mm |
| July | 9.9°C / 49.8°F | 14.5°C / 5.8°C | 108.3 mm |
| August | 11.6°C / 52.9°F | 16.2°C / 7.8°C | 92.2 mm |
| September | 13.8°C / 56.8°F | 18.3°C / 9.7°C | 137.7 mm |
| October | 16.2°C / 61.2°F | 20.3°C / 12.5°C | 92.2 mm |
| November | 19.0°C / 66.2°F | 23.9°C / 13.9°C | 109.6 mm |
| December | 22.1°C / 71.8°F | 27.1°C / 16.6°C | 89.6 mm |
The temperature pattern is clear even though individual days vary. Conditions rise rapidly toward summer, remain warm through February, cool through autumn, and bottom out in July. Rainfall is less orderly. Higher and lower monthly totals occur in different seasons, so temperature alone cannot identify a dependable dry period.
Summer weather: December, January, and February
Austral summer is the clearest choice for travelers prioritizing warm-weather beach time. Regional mean temperatures remain above 22°C throughout December, January, and February. Rain is still part of the climate, however, and February has the highest precipitation average in the benchmark.
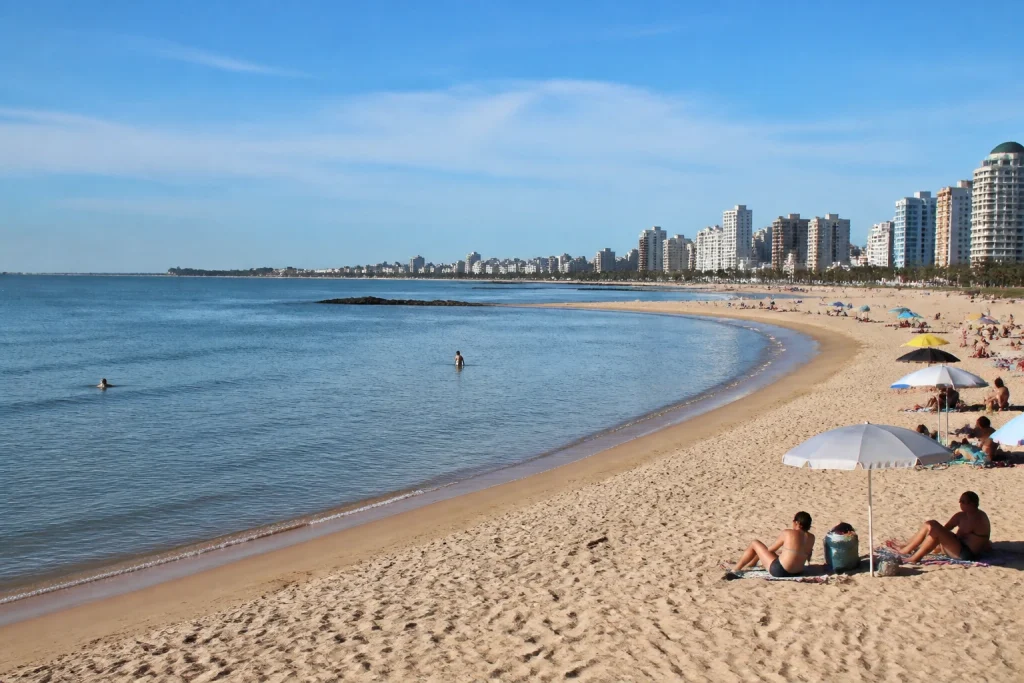
December: warm days at the start of summer
December averages 22.1°C, with a mean high of 27.1°C and a mean low of 16.6°C. Average precipitation is 89.6 mm. Those temperatures suit a warm-weather itinerary, but the lower nighttime benchmark makes a light extra layer useful after sunset or during a breezy spell.
January: the warmest benchmark month
January has the highest mean temperature in the table at 23.2°C. Its mean high reaches 28.3°C, while the mean low is 18.2°C. Precipitation averages 105.4 mm, so warm conditions do not remove the need for a rain plan. Check the daily forecast before committing every hour to the shore.
February: warm temperatures with a wetter benchmark
February remains warm, averaging 22.4°C with a mean high of 26.9°C and a mean low of 18.4°C. Its 147.8 mm precipitation average is the highest in the regional table. That figure does not mean continuous rain, but it does argue for flexible beach days and a lightweight waterproof layer.
For any summer visit, compare the short-range conditions before choosing a shoreline. The Playa Brava versus Playa Mansa beach comparison can help you decide which beach better fits the day you have planned.
Autumn weather: March, April, and May
Autumn brings a steady cooling trend. Mean temperatures move from 20°C in March to 14.4°C in May, while mean nighttime lows fall from 15.5°C to 10.2°C. Travelers who prefer moderate daytime temperatures can find this period appealing, but later autumn requires warmer layers.

Gourmet Picnic at Viña Edén
Our vineyards sit on Pueblo Eden’s rocky mountains slopes. The mineral character of our soils and it’s oceanic i...

Private Tour in Punta del Este
You will live the Punta del Este experience on an exciting guided tour with personalized service where you will disc...

Discover Punta del Este: Private City Tour with a Local Guide
Discover Punta del Este in comfort with a private experience designed to let you enjoy the destination at your own p...
March: a warm transition into autumn
March averages 20°C, with a mean high of 24.9°C and a mean low of 15.5°C. Average precipitation falls to 74.9 mm in the regional benchmark. Pack for pleasantly warm daytime conditions as well as cooler mornings, evenings, and weather changes.
April: milder days and cooler evenings
April has a mean temperature of 17.1°C. The mean high is 21.7°C, the mean low is 12.7°C, and precipitation averages 91.2 mm. This is layering weather: a comfortable afternoon can give way to a distinctly cooler evening, while a compact rain shell keeps plans adaptable.
May: the lowest rainfall average, but not a dry-season promise
May averages 14.4°C, with a mean high of 18.8°C and a mean low of 10.2°C. Its 66.2 mm precipitation average is the lowest in the table. It is still inaccurate to call May reliably dry, since the figure is a long-term monthly average rather than a forecast for your dates.
Winter weather: June, July, and August
Winter is the coolest part of the year and is less naturally suited to a trip built around warm beach weather. Mean highs remain between 14.5°C and 16.2°C in the regional benchmark, while mean lows range from 5.8°C to 7.8°C. Warm layers and weather-resistant outerwear become central rather than optional extras.
June: the start of the coolest season
June averages 11.1°C, with a mean high of 15.7°C and a mean low of 6.7°C. Average precipitation is 72.5 mm. Plan around cool mornings and evenings, and keep outdoor schedules adjustable if rain, wind, or reduced visibility enters the local forecast.
July: the coldest benchmark month
July is the coolest month in the table, averaging 9.9°C. Its mean high is 14.5°C, its mean low is 5.8°C, and average precipitation reaches 108.3 mm. This is a month for coats, layered clothing, closed shoes, and plans that do not depend entirely on long hours at the beach.
August: cool conditions before spring
August warms slightly to a mean of 11.6°C. The mean high is 16.2°C, the mean low is 7.8°C, and precipitation averages 92.2 mm. It remains firmly within the cool season, so a brighter afternoon should not tempt you to leave every warm layer at the hotel.
Fog is common in Uruguay during winter. Drivers should check conditions before setting out, allow flexibility when visibility is poor, and avoid treating the climate averages as a road forecast.
Spring weather: September, October, and November
Spring temperatures rise quickly toward summer. The regional mean moves from 13.8°C in September to 19°C in November. Rainfall remains important, especially in September, so spring rewards a layered wardrobe and an itinerary that can shift with the daily forecast.
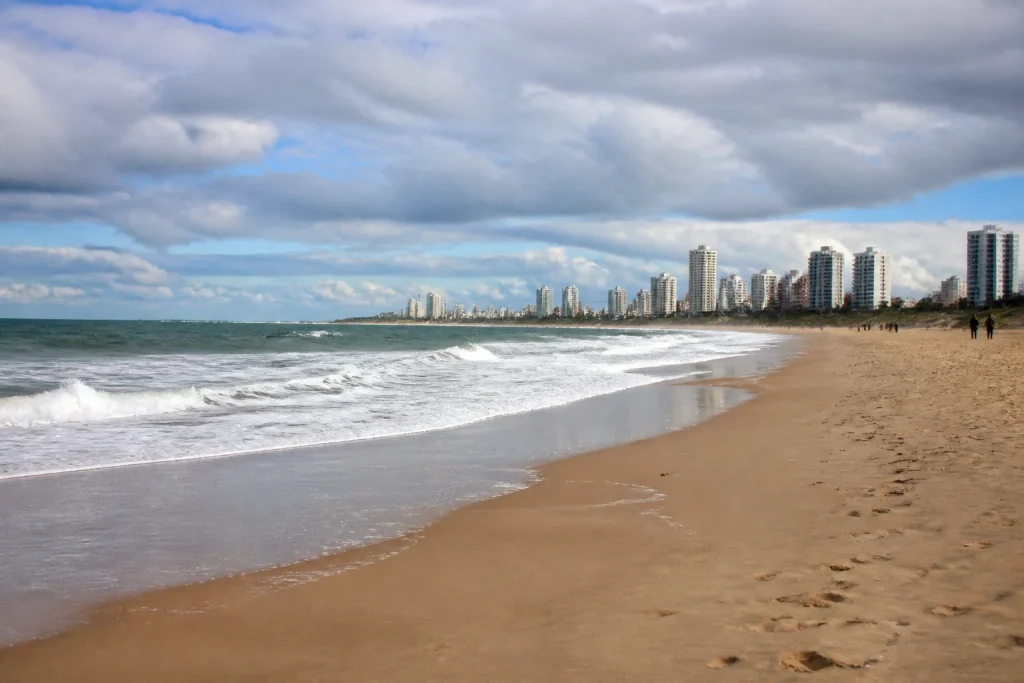
September: milder temperatures with a high rainfall average
September averages 13.8°C, with a mean high of 18.3°C and a mean low of 9.7°C. Average precipitation reaches 137.7 mm, the second-highest total in the table after February. Pack for both crisp periods and milder afternoons rather than relying on a single seasonal outfit.
October: moderate spring conditions
October has a mean temperature of 16.2°C, a mean high of 20.3°C, and a mean low of 12.5°C. Precipitation averages 92.2 mm. Daytime conditions are milder than winter, but the monthly low and rainfall figures still favor a light sweater and rain-resistant outer layer.
November: warming rapidly toward summer
November averages 19°C, with a mean high of 23.9°C and a mean low of 13.9°C. Average precipitation is 109.6 mm. The warmer pattern makes outdoor planning easier than in winter, but evenings can still feel cool and rainfall remains a realistic part of the month.
Still comparing Punta Del Este Weather By Month?
Ask for tour ideas, hotel suggestions, or a simple trip plan that combines both.
Trip Helper
Which month best matches your travel plans?
- For the warmest beach weather: choose December, January, or February, with January holding the highest mean temperature.
- For warm but less midsummer-like temperatures: consider March or November, whose regional mean highs are 24.9°C and 23.9°C.
- For moderate sightseeing temperatures: April or October provides mean highs near 20°C, though rain remains possible.
- For the coolest conditions: choose June, July, or August and pack substantial layers.
- For the lowest regional rainfall average: May has the smallest monthly total, but it is not guaranteed to be dry.
The best choice therefore depends more on temperature preferences than on finding a dry season. Beach-focused travelers have the strongest climate case for summer. Visitors comfortable with cooler air can choose another season, provided they bring layers and leave room to rearrange weather-sensitive activities.
On a mixed-weather trip, use the guide to Punta del Este's best things to do for first-time visitors to build a varied plan rather than filling every day with the same outdoor activity.
Rain, wind, fog, and the forecast that matters
Climate averages help you choose a season, but the Punta del Este destination forecast should shape the final plan. Check it close to departure and again before a weather-sensitive outing. Pay particular attention to rain, wind, fog, and thunderstorm information, since each can affect beach time, driving, and exposed outdoor activities.
INUMET includes Punta del Este in its forecast and observation network. Uruguay's national emergency system also publishes weather-risk information. Use those current services instead of relying on an old forecast saved during the early stages of trip planning.
Avoid reading a high monthly rainfall figure as a verdict on your exact dates. It describes accumulated precipitation across a long climate period, not the number of rainy vacation days you will experience. Likewise, the lowest monthly average does not guarantee uninterrupted sunshine.
What to pack for each season
- Summer: lightweight clothing, sun protection, a light evening layer, and a compact rain shell.
- Autumn: short and long sleeves, a sweater or fleece, closed shoes, and rain-resistant outerwear.
- Winter: warm layers, a coat, closed shoes, and protection from rain and wind.
- Spring: flexible layers, a light sweater, rain gear, and clothing that works across changing temperatures.
- All year: a small weatherproof day bag or cover for items you carry during outdoor plans.
The goal is flexibility rather than an oversized suitcase. Mean highs and lows show that one month can span distinctly different parts of the day. A removable layer is useful even during warm seasons, while a rain shell earns its place in every month because the regional climate has no dependable dry period.
Accessibility and personal safety planning
Travelers who need step-free beach access, accessible transportation, or mobility assistance should confirm arrangements with their accommodation, operator, or local tourism authority. Weather averages cannot establish the condition of a route or the availability of seasonal services.
Weather is not the only practical consideration. A U.S. State Department advisory dated July 28, 2026 places Uruguay at Level 2, Exercise Increased Caution, because of crime and lists Maldonado among the departments where crime is most common. Guard valuables, remain aware of your surroundings, and consult the travel advice issued for your circumstances before departure.

Private Transfer from Punta Del Este Port to Carrasco Airport MVD
Book your private transfer from Punta Del Este Cruise Port to Montevideo Carrasco International Airport (MVD). Avoi...

Private Transfer from Montevideo to Punta Del Este Cruise Port
Book your Private Transfer from Montevideo city hotels or any address to Punta Del Este Cruise Port. Don't go throu...
Private Transfer - Carrasco Airport (MVD) to Punta Del Este Port
Book your Private Transfer from Montevideo Carrasco International Airport (MVD) to Punta Del Este Cruise Port. Don...
Choosing your Punta del Este travel month
Choose December through February if warm beach weather is the priority, with January offering the highest regional mean temperature. Pick autumn or spring for moderate temperatures and a layered, flexible itinerary. Winter suits travelers comfortable with cool conditions and less beach-oriented plans. Whatever the month, allow for rain and use a current Punta del Este forecast to make the final call on outdoor activities.
Frequently asked questions
What is the warmest month in Punta del Este?
January is the warmest month in the official regional benchmark, with a mean temperature of 23.2°C and a mean high of 28.3°C. The figures come from Carrasco Airport and describe the broader regional pattern rather than Punta del Este station observations.
What is the coldest month in Punta del Este?
July is the coolest benchmark month, averaging 9.9°C with a mean high of 14.5°C and a mean low of 5.8°C. Warm layers and weather-resistant outerwear are sensible for a winter visit.
What are the best months for beach weather in Punta del Este?
December through February offers the warmest regional temperature pattern for a beach-focused trip. Rain can occur throughout summer, so use the current destination forecast when scheduling individual beach days.
What is the driest month in Punta del Este?
May has the lowest precipitation average in the regional table at 66.2 mm, but it should not be treated as a reliably dry month. Every month in the benchmark averages meaningful precipitation, and climate totals do not predict weather on specific dates.
Does it rain throughout the year in Punta del Este?
Rain should be considered possible throughout the year. The regional benchmark records monthly precipitation averages ranging from 66.2 mm in May to 147.8 mm in February, without a dependable dry season.
Is fog a concern during winter?
Fog is common in Uruguay during winter, particularly from June through August. Check local conditions before driving and allow flexibility when visibility is poor.
Are the monthly figures recorded in Punta del Este?
No, the detailed monthly table is based on observations at Carrasco Airport near Montevideo. It is presented as a regional climate benchmark and should be combined with a current Punta del Este forecast.
Punta del Este Classic City Tour with Sunset at Casapueblo
This tour is the best way to get to know Punta del Este in depth. If it's your first time in Punta, we recommend taking the City Classic to get a good...

Museo Ralli Private Guided Tour in Punta del Este
Step into a world of surrealism and sculpture at Museo Ralli, home to works by Dalí, Chagall, and Latin American ma...
Punta del Este Shore Excursion: Private Sightseeing Tour of Punta del Este
Explore the sophisticated resort town of Punta del Este on this 4-hour private shore excursion. With a private guide...
Punta del Este Shore Tour for Cruise Passengers
Join us on a tour to discover Punta del Este, one of Latin America’s most exclusive destinations. With its elegant...